My 4th semester involves ARM programming. And proprietary tooling (Keil C). But we don't do that here.
Building
Assembling and linking ARM binaries on non-ARM architecture
devices is fairly trivial. I went along with the GNU cross
bare metal toolchain binutils, which provides arm-as and
arm-ld (among a bunch of other utils that I don't care
about for now).
Assemble .s files with:
arm-none-eabi-as main.s -g -march=armv8.1-a -o main.out
The -g flag generates extra debugging information that
gdb picks up. The -march option establishes target
architecture.
Link .o files with:
arm-none-eabi-ld main.out -o main
Running (and Debugging)
Things get interesting here. gdb on your x86 machine
cannot read nor execute binaries compiled for ARM. So, we
simulate an ARM processor using qemu. Now qemu allows you
to run gdbserver on startup. Connecting our local gdb
instance to gdbserver gives us a view into the program’s
execution. Easy!
Run qemu, with gdbserver on port 1234, with our ARM
binary, main:
qemu-arm -singlestep -g 1234 main
Start up gdb on your machine, and connect to qemu’s
gdbserver:
(gdb) set architecture armv8-a
(gdb) target remote localhost:1234
(gdb) file main
Reading symbols from main...  # yay!
GDB Enhanced
gdb is cool, but it's not nearly as comfortable as well
fleshed out emulators/IDEs like Keil. Watching registers,
CPSR and memory chunks update is pretty fun.
I came across gdb's TUI mode (hit C-x C-a or type tui
enable at the prompt). TUI mode is a godsend. It highlights
the current line of execution, shows you disassembly
outputs, updated registers, active breakpoints and more.
But, it is an absolute eyesore.
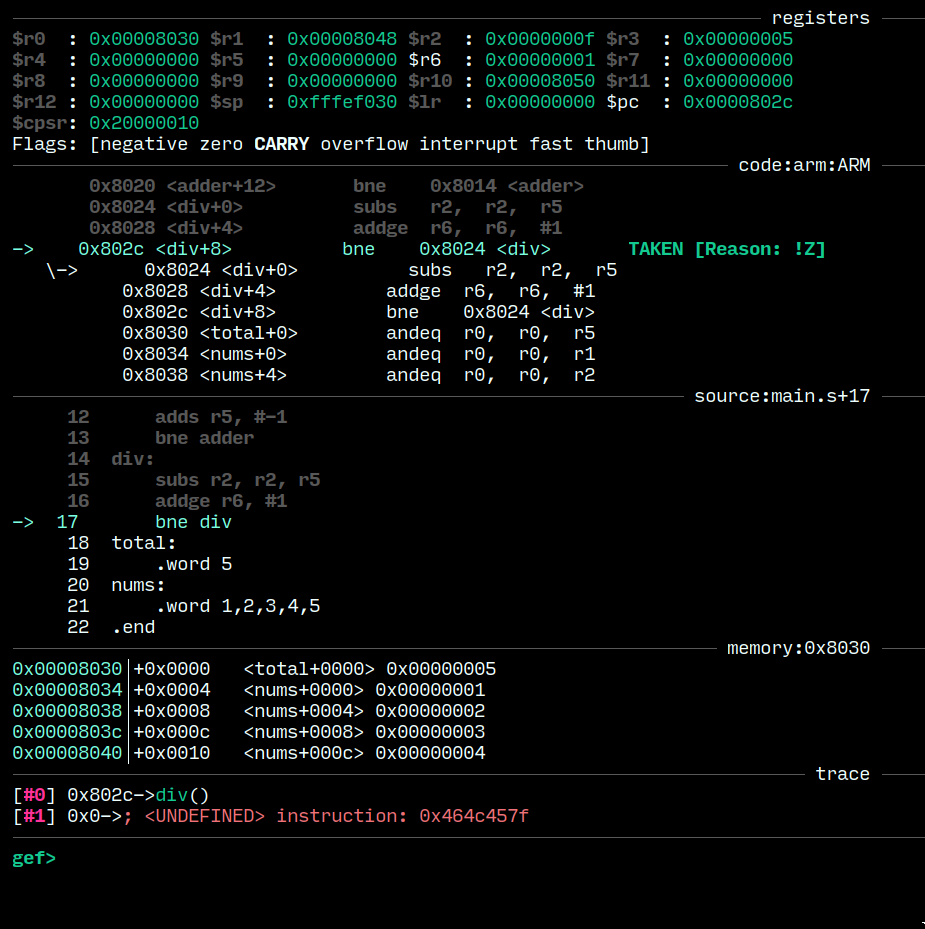
Say hello to GEF! “GDB Enhanced Features” teaches our old dog some cool new tricks. Here are some additions that made my ARM debugging experience loads better:
- Memory watches
- Register watches, with up to 7 levels of deref (overkill, I agree)
- Stack tracing
And its pretty! See for yourself:

Editing
Vim, with syntax off because it
dosen't handle GNU ARM syntax too well.