
diff options
| author | bors[bot] <26634292+bors[bot]@users.noreply.github.com> | 2021-05-11 19:02:31 +0100 |
|---|---|---|
| committer | GitHub <[email protected]> | 2021-05-11 19:02:31 +0100 |
| commit | e290891dd75f2ae2d156e8610fd037a84c1b853f (patch) | |
| tree | a7a8eb48ae6d5e4ccb759d1b2c180d522170097d /crates/test_utils | |
| parent | 6afd9b2b8dcfaa9338303f29d8fc6c90dbcdd6e7 (diff) | |
| parent | d1aa6bbe753e50517d568a4b7560f765fbc75bd2 (diff) | |
Merge #8801
8801: feat: Allow viewing the crate graph in a webview r=jonas-schievink a=jonas-schievink
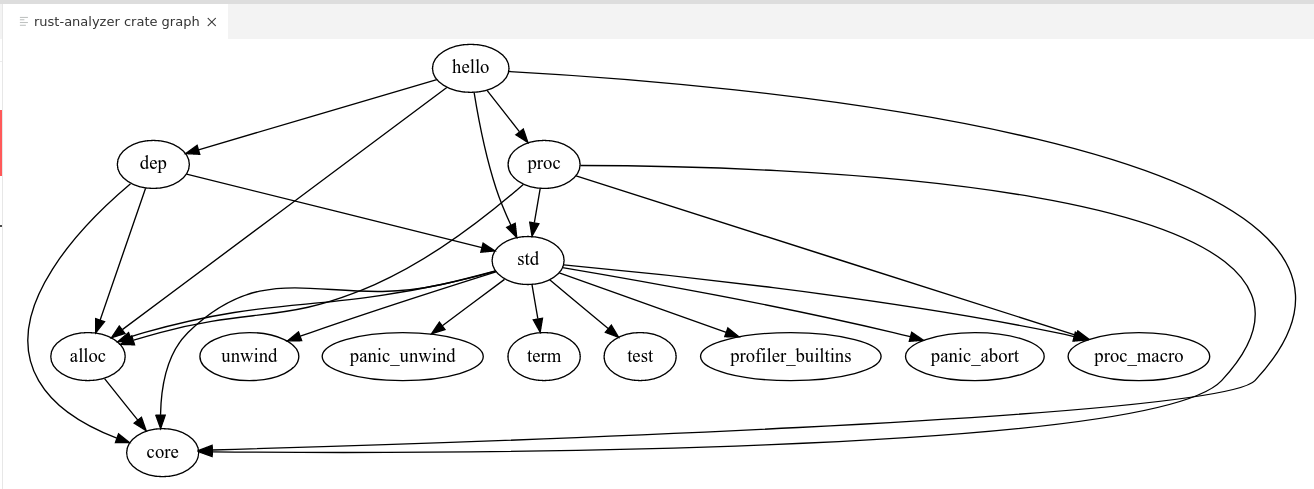
This uses `dot` to render the crate graph as an SVD file, and displays it in a VS Code panel. For simple crate graphs, it works quite well:
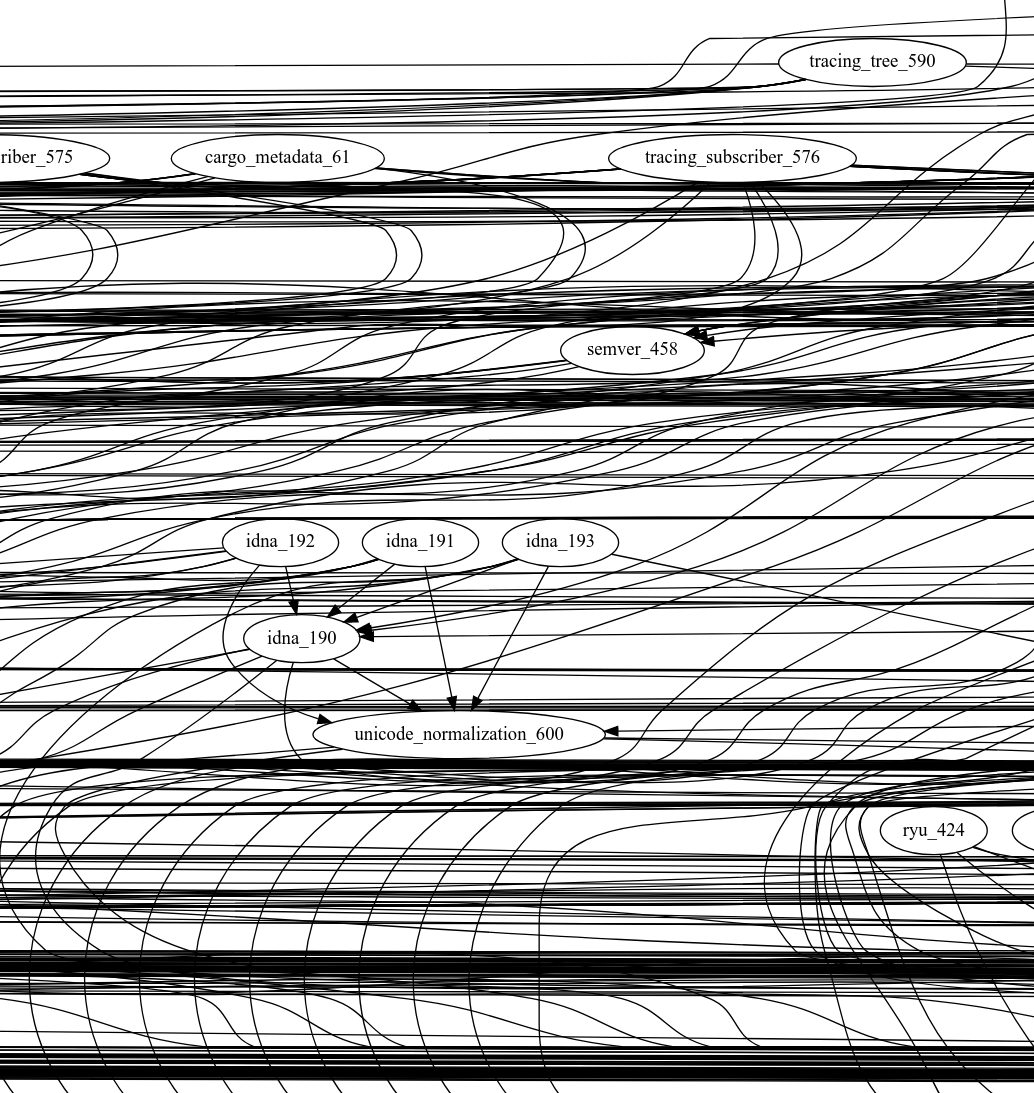
Unfortunately, on rust-analyzer itself (and most medium-sized dependency graphs), `dot` runs for around a minute and then produces this mess:
Co-authored-by: Jonas Schievink <[email protected]>
Diffstat (limited to 'crates/test_utils')
0 files changed, 0 insertions, 0 deletions