1
2
3
4
5
6
7
8
9
10
11
12
13
14
15
16
17
18
19
20
21
22
23
24
25
26
27
28
29
30
31
32
33
34
35
36
37
38
39
40
41
42
43
44
45
46
47
48
49
50
51
52
53
54
55
56
57
58
59
60
61
62
63
64
65
66
67
68
69
70
71
72
73
74
75
76
77
78
79
80
81
82
83
84
85
86
87
88
89
90
91
92
93
94
95
96
97
98
99
100
101
102
103
104
105
106
107
108
109
110
111
112
113
114
115
116
117
118
119
120
121
122
123
124
125
126
127
128
129
130
131
132
133
134
135
136
137
138
139
140
141
142
143
144
145
146
147
148
149
150
151
152
153
154
155
156
157
158
159
160
161
162
163
164
165
166
167
168
169
170
171
172
173
174
175
176
177
178
179
180
181
182
183
184
185
186
187
188
189
190
191
|
# Contributing Quick Start
Rust Analyzer is just a usual rust project, which is organized as a Cargo
workspace, builds on stable and doesn't depend on C libraries. So, just
```
$ cargo test
```
should be enough to get you started!
To learn more about how rust-analyzer works, see
[./architecture.md](./architecture.md) document.
We also publish rustdoc docs to pages:
https://rust-analyzer.github.io/rust-analyzer/ra_ide/
Various organizational and process issues are discussed in this document.
# Getting in Touch
Rust Analyzer is a part of [RLS-2.0 working
group](https://github.com/rust-lang/compiler-team/tree/6a769c13656c0a6959ebc09e7b1f7c09b86fb9c0/working-groups/rls-2.0).
Discussion happens in this Zulip stream:
https://rust-lang.zulipchat.com/#narrow/stream/185405-t-compiler.2Fwg-rls-2.2E0
# Issue Labels
* [good-first-issue](https://github.com/rust-analyzer/rust-analyzer/labels/good%20first%20issue)
are good issues to get into the project.
* [E-mentor](https://github.com/rust-analyzer/rust-analyzer/issues?q=is%3Aopen+is%3Aissue+label%3AE-mentor)
issues have links to the code in question and tests.
* [E-easy](https://github.com/rust-analyzer/rust-analyzer/issues?q=is%3Aopen+is%3Aissue+label%3AE-easy),
[E-medium](https://github.com/rust-analyzer/rust-analyzer/issues?q=is%3Aopen+is%3Aissue+label%3AE-medium),
[E-hard](https://github.com/rust-analyzer/rust-analyzer/issues?q=is%3Aopen+is%3Aissue+label%3AE-hard),
labels are *estimates* for how hard would be to write a fix.
* [fun](https://github.com/rust-analyzer/rust-analyzer/issues?q=is%3Aopen+is%3Aissue+label%3Afun)
is for cool, but probably hard stuff.
# CI
We use GitHub Actions for CI. Most of the things, including formatting, are checked by
`cargo test` so, if `cargo test` passes locally, that's a good sign that CI will
be green as well. The only exception is that some long-running tests are skipped locally by default.
Use `env RUN_SLOW_TESTS=1 cargo test` to run the full suite.
We use bors-ng to enforce the [not rocket science](https://graydon2.dreamwidth.org/1597.html) rule.
You can run `cargo xtask install-pre-commit-hook` to install git-hook to run rustfmt on commit.
# Code organization
All Rust code lives in the `crates` top-level directory, and is organized as a
single Cargo workspace. The `editors` top-level directory contains code for
integrating with editors. Currently, it contains the plugin for VS Code (in
typescript). The `docs` top-level directory contains both developer and user
documentation.
We have some automation infra in Rust in the `xtask` package. It contains
stuff like formatting checking, code generation and powers `cargo xtask install`.
The latter syntax is achieved with the help of cargo aliases (see `.cargo`
directory).
# Launching rust-analyzer
Debugging language server can be tricky: LSP is rather chatty, so driving it
from the command line is not really feasible, driving it via VS Code requires
interacting with two processes.
For this reason, the best way to see how rust-analyzer works is to find a
relevant test and execute it (VS Code includes an action for running a single
test).
However, launching a VS Code instance with locally build language server is
possible. There's **"Run Extension (Debug Build)"** launch configuration for this.
In general, I use one of the following workflows for fixing bugs and
implementing features.
If the problem concerns only internal parts of rust-analyzer (ie, I don't need
to touch `rust-analyzer` crate or typescript code), there is a unit-test for it.
So, I use **Rust Analyzer: Run** action in VS Code to run this single test, and
then just do printf-driven development/debugging. As a sanity check after I'm
done, I use `cargo xtask install --server` and **Reload Window** action in VS
Code to sanity check that the thing works as I expect.
If the problem concerns only the VS Code extension, I use **Run Installed Extension**
launch configuration from `launch.json`. Notably, this uses the usual
`rust-analyzer` binary from `PATH`. For this it is important to have the following
in `setting.json` file:
```json
{
"rust-analyzer.serverPath": "rust-analyzer"
}
```
After I am done with the fix, I use `cargo
xtask install --client-code` to try the new extension for real.
If I need to fix something in the `rust-analyzer` crate, I feel sad because it's
on the boundary between the two processes, and working there is slow. I usually
just `cargo xtask install --server` and poke changes from my live environment.
Note that this uses `--release`, which is usually faster overall, because
loading stdlib into debug version of rust-analyzer takes a lot of time. To speed
things up, sometimes I open a temporary hello-world project which has
`"rust-analyzer.withSysroot": false` in `.code/settings.json`. This flag causes
rust-analyzer to skip loading the sysroot, which greatly reduces the amount of
things rust-analyzer needs to do, and makes printf's more useful. Note that you
should only use `eprint!` family of macros for debugging: stdout is used for LSP
communication, and `print!` would break it.
If I need to fix something simultaneously in the server and in the client, I
feel even more sad. I don't have a specific workflow for this case.
Additionally, I use `cargo run --release -p rust-analyzer -- analysis-stats
path/to/some/rust/crate` to run a batch analysis. This is primarily useful for
performance optimizations, or for bug minimization.
# Logging
Logging is done by both rust-analyzer and VS Code, so it might be tricky to
figure out where logs go.
Inside rust-analyzer, we use the standard `log` crate for logging, and
`env_logger` for logging frontend. By default, log goes to stderr, but the
stderr itself is processed by VS Code.
To see stderr in the running VS Code instance, go to the "Output" tab of the
panel and select `rust-analyzer`. This shows `eprintln!` as well. Note that
`stdout` is used for the actual protocol, so `println!` will break things.
To log all communication between the server and the client, there are two choices:
* you can log on the server side, by running something like
```
env RA_LOG=gen_lsp_server=trace code .
```
* you can log on the client side, by enabling `"rust-analyzer.trace.server":
"verbose"` workspace setting. These logs are shown in a separate tab in the
output and could be used with LSP inspector. Kudos to
[@DJMcNab](https://github.com/DJMcNab) for setting this awesome infra up!
There's also two VS Code commands which might be of interest:
* `Rust Analyzer: Status` shows some memory-usage statistics. To take full
advantage of it, you need to compile rust-analyzer with jemalloc support:
```
$ cargo install --path crates/rust-analyzer --force --features jemalloc
```
There's an alias for this: `cargo xtask install --server --jemalloc`.
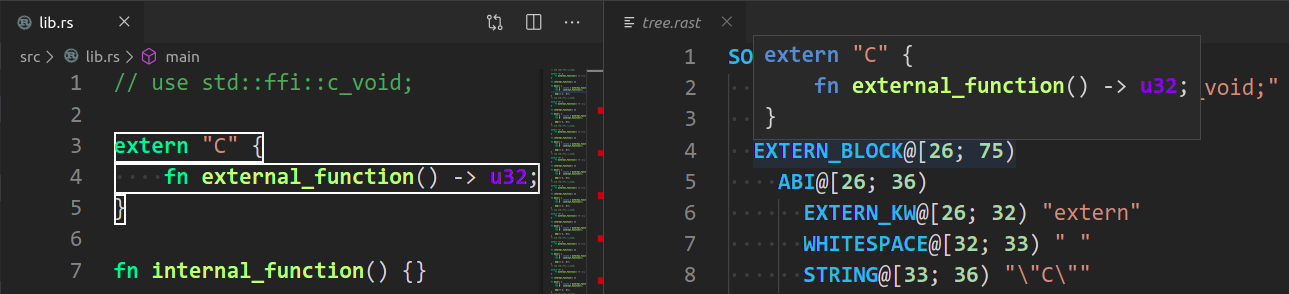
* `Rust Analyzer: Syntax Tree` shows syntax tree of the current file/selection.
You can hover over syntax nodes in the opened text file to see the appropriate
rust code that it refers to and the rust editor will also highlight the proper
text range.
If you press <kbd>Ctrl</kbd> (i.e. trigger goto definition) in the inspected
Rust source file the syntax tree read-only editor should scroll to and select the
appropriate syntax node token.
# Profiling
We have a built-in hierarchical profiler, you can enable it by using `RA_PROFILE` env-var:
```
RA_PROFILE=* // dump everything
RA_PROFILE=foo|bar|baz // enabled only selected entries
RA_PROFILE=*@3>10 // dump everything, up to depth 3, if it takes more than 10 ms
```
In particular, I have `export RA_PROFILE='*>10'` in my shell profile.
To measure time for from-scratch analysis, use something like this:
```
$ cargo run --release -p rust-analyzer -- analysis-stats ../chalk/
```
For measuring time of incremental analysis, use either of these:
```
$ cargo run --release -p rust-analyzer -- analysis-bench ../chalk/ --highlight ../chalk/chalk-engine/src/logic.rs
$ cargo run --release -p rust-analyzer -- analysis-bench ../chalk/ --complete ../chalk/chalk-engine/src/logic.rs:94:0
```
|
