1
2
3
4
5
6
7
8
9
10
11
12
13
14
15
16
17
18
19
20
21
22
23
24
25
26
27
28
29
30
31
32
33
34
35
36
37
38
39
40
41
42
43
44
45
46
47
48
49
50
51
52
53
54
55
56
57
58
59
60
61
62
63
64
65
66
67
68
69
70
71
72
73
74
75
76
77
78
79
80
81
82
83
84
|
My 4th semester involves ARM programming. And proprietary
tooling (Keil C). But we don't do that here.
### Building
Assembling and linking ARM binaries on non-ARM architecture
devices is fairly trivial. I went along with the GNU cross
bare metal toolchain binutils, which provides `arm-as` and
`arm-ld` (among a bunch of other utils that I don't care
about for now).
Assemble `.s` files with:
```shell
arm-none-eabi-as main.s -g -march=armv8.1-a -o main.out
```
The `-g` flag generates extra debugging information that
`gdb` picks up. The `-march` option establishes target
architecture.
Link `.o` files with:
```shell
arm-none-eabi-ld main.out -o main
```
### Running (and Debugging)
Things get interesting here. `gdb` on your x86 machine
cannot read nor execute binaries compiled for ARM. So, we
simulate an ARM processor using `qemu`. Now qemu allows you
to run `gdbserver` on startup. Connecting our local `gdb`
instance to `gdbserver` gives us a view into the program's
execution. Easy!
Run `qemu`, with `gdbserver` on port `1234`, with our ARM
binary, `main`:
```shell
qemu-arm -singlestep -g 1234 main
```
Start up `gdb` on your machine, and connect to `qemu`'s
`gdbserver`:
```
(gdb) set architecture armv8-a
(gdb) target remote localhost:1234
(gdb) file main
Reading symbols from main... # yay!
```
### GDB Enhanced
`gdb` is cool, but it's not nearly as comfortable as well
fleshed out emulators/IDEs like Keil. Watching registers,
CPSR and memory chunks update *is* pretty fun.
I came across `gdb`'s TUI mode (hit `C-x C-a` or type `tui
enable` at the prompt). TUI mode is a godsend. It highlights
the current line of execution, shows you disassembly
outputs, updated registers, active breakpoints and more.
*But*, it is an absolute eyesore.
Say hello to [GEF](https://github.com/hugsy/gef)! "GDB
Enhanced Features" teaches our old dog some cool new tricks.
Here are some additions that made my ARM debugging
experience loads better:
- Memory watches
- Register watches, with up to 7 levels of deref (overkill,
I agree)
- Stack tracing
And it's pretty! See for yourself:
[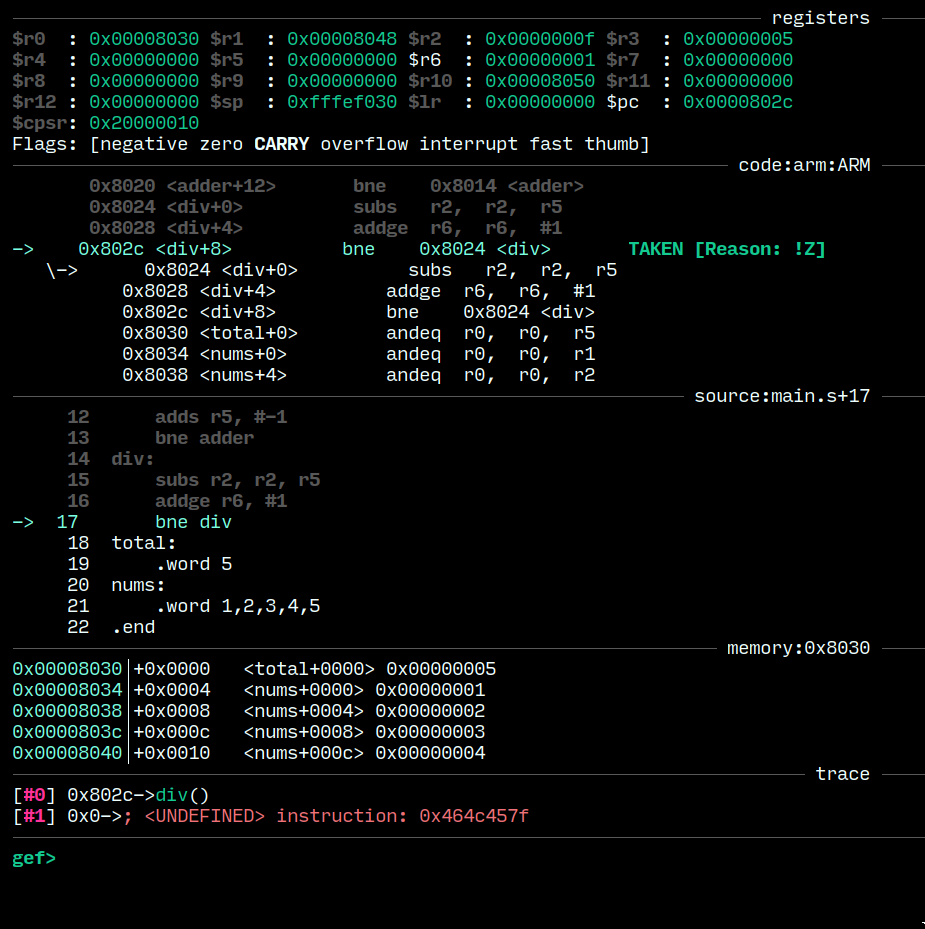](https://u.peppe.rs/wq.png)
### Editing
Vim, with `syntax off` because it
dosen't handle GNU ARM syntax too well.
|
